The term Internet of Things (IoT) is buzzing all around. From the smartphones in our pockets to the thermostats, doorbells and lights in our houses, we're finding that more and more of our devices are being connected to the internet. Being able to control my thermostat remotely using something like the Nest isn't as interesting as being able to see what the temperature is remotely and log that data. Luckily, it's getting easier and easier to bring IoT to the classroom through maker education. Here's a quick project I pulled together to show off a few easy-to-use tools that we have at SparkFun to create your own IoT temperature data logger.
The Motivation
A few years ago, I got hooked on the backyard chicken movement here in Boulder. With your own flock of hens, you can enjoy a nearly limitless supply of fresh eggs daily. My first flock of hens came from some awesome 4-H kids at the annual Boulder County Fair, but recently I've really enjoyed starting my flock with baby chicks. Around this time of year, the local farm and feed stores bring in a few hundred day-old chicks each week for people to take home and raise. These little critters are just barely larger than the egg from which they hatched. They're fluffy, fuzzy, yellow, and adorable!
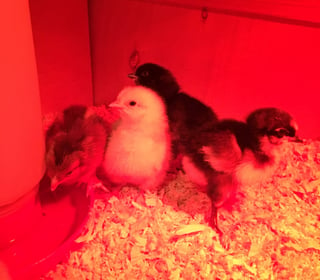
Baby chicks are amazingly cute, but they're also fragile. There are many resources and tips for caring for day-old chicks. The most important is to keep the temperature of the brooder warm, but not too warm! Most general guidelines suggest that you keep the brooder at 95 degrees Fahrenheit for the first week and then decrease the temperature by 5 degrees each week by moving the heat lamp up a few inches. They also suggest making sure the brooder is large enough that the chicks can get away from the heat if necessary.
You can use an old-fashioned thermometer for this, but since I work at SparkFun, I figured it would be fun to build a quick temperature data logger to track the temperature near the heat lamp and another one for the other side of the brooder. This is actually a project that we've had for a while in our office, logging the temperature swings of our HVAC system. It's based on the ESP8266 Thing Dev, a BMP180 temperature/pressure sensor, and the data.sparkfun.com open data channel. To graph and visualize the data, our friends at analog.io created a nice JavaScript interface to plot the data from data.sparkfun.com. Here you can see some data from the past two days in our office. The folks at analog.io make the raw data a whole lot easier to view and interpret!
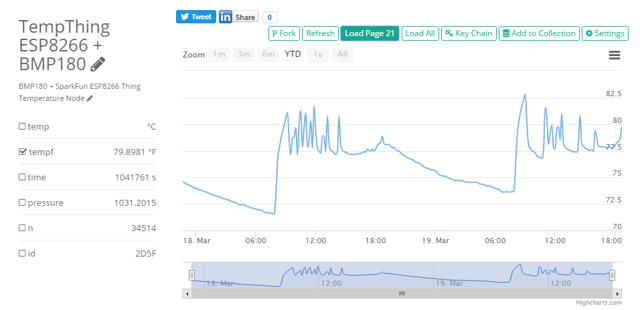
The sharp spikes you see in this data are active heating and then active cooling throughout the day. Sitting under one of these vents means you'll feel swings of 90 degree hot air blowing down on you and then 50 degree cold air as the HVAC attempts to regulate itself. What's really interesting is that this is from the weekend, and it's all pre-programmed in our thermostat.
The Hardware
The hardware for this project is pretty simple. The boards all come without headers, so you'll need to either solder headers or wires directly to them.
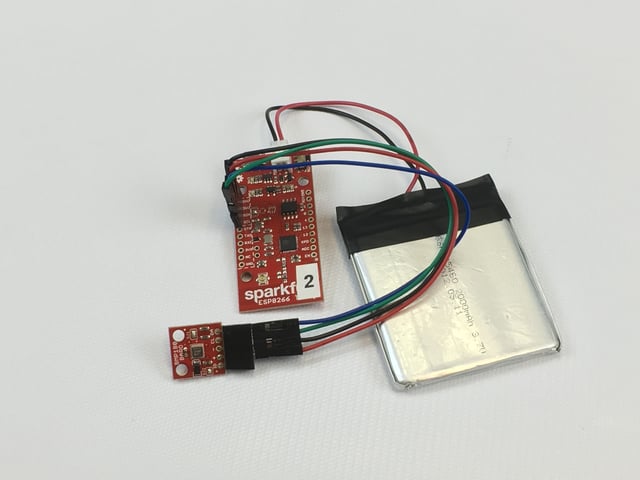
On the left side of the ESP8266 board are pins for I2C communication. This is the way the microcontroller will interface with the BMP180 sensor. I2C uses four wires to connect between the microcontroller and the sensor. These are: 3.3V (3V3) or (+), GND or (-), SDA (data), and SCL (clock). I2C devices are really nice to work with because multiple devices can be daisy-chained together using the same four lines. In this case, we're just using one. The battery is added as a backup and is entirely optional.
The Code
To program the ESP8266, you'll need Arduino installed with the SparkFun boards. If you don't have this, go to sparkfun.com/arduinoboards to install the boards file in Arduino. This example uses two additional libraries (Phant and BMP180), which I've already bundled together. Here's a zip file with everything you'll need. Download this and open the RemoteTemperatureLogger.ino file. If you're curious, the original code is available on GitHub.
In the code, you'll see that we create a unique ID for each ESP8266 board based on its MAC address. Using this technique, you can have multiple data logger units all posting to the same channel.
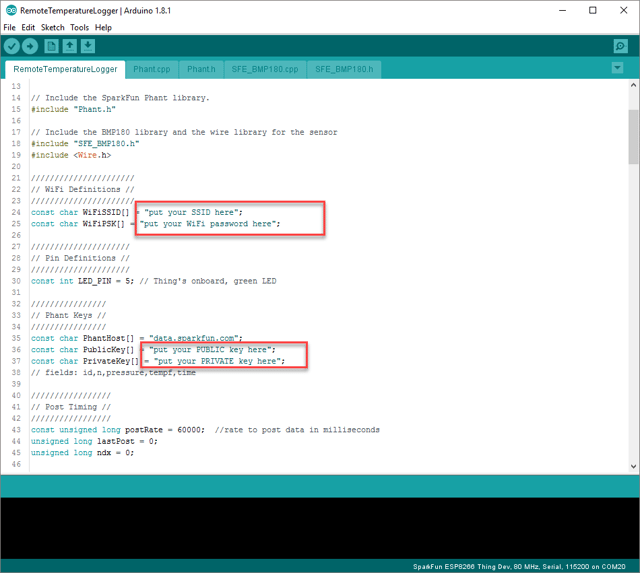
There are a few things you'll need to customize for your own setup. Change lines 24 and 25 to correspond to the WiFi SSID and password for your own router. And update the PUBLIC and PRIVATE key for your own data channel. If you haven't set up a data channel yet, take a look at the next section.
Setting up the Data Channel
This example is based on our open source data channel, data.sparkfun.com, which is based on a platform we've developed called phant (short for elephant). It accepts raw data from a simple HTTP POST command. Full documentation on phant is available here.
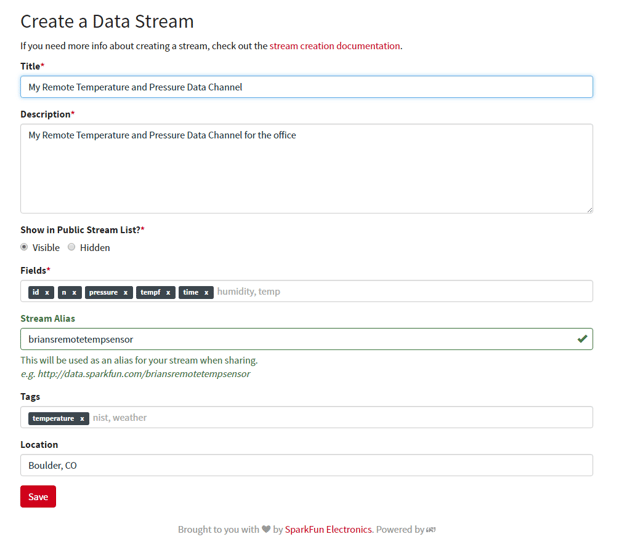
For this project, you'll need to create your own data channel. First go to data.sparkfun.com and create a data channel with the following fields: id, n, pressure, tempf and time.
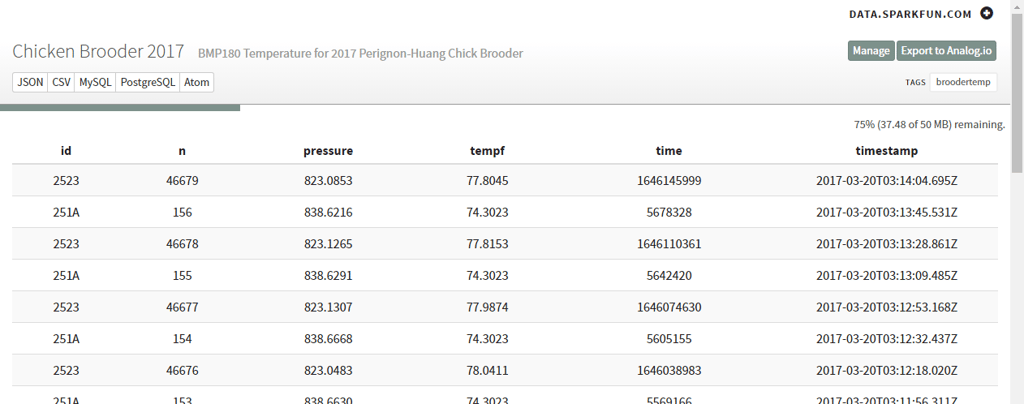
The id is the unique identifier for each ESP8266; n indicates the data index count — if you see skips in this, it means that there was a datapoint dropped; pressure is the pressure measured in mm Hg; tempf represents the temperature converted to Farhenheit; and time is a simple seconds counter that is used to give a rough estimate of time from when the board was powered on.
After you've put in all of the necessary fields, click Save.
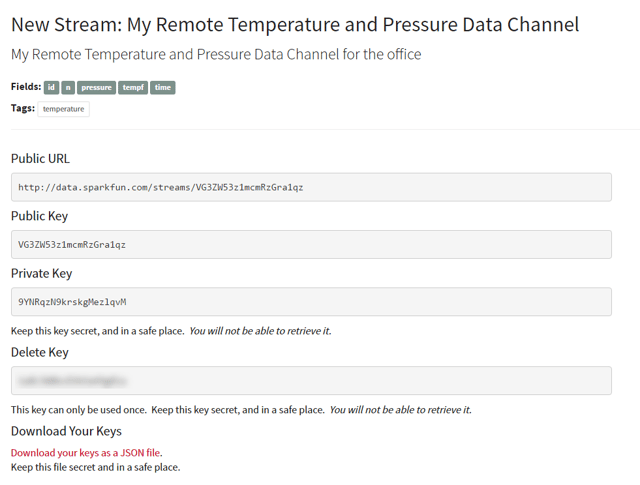
Now you'll see the keys for your data channel. Save these in a special place. I suggest downloading the keys as a JSON file to your computer. This is a plain-text format that you can always go back to.
Copy and paste the Public Key and the Private Key from this view into your code. The public URL is what you can share with anyone you want to provide public access to your data. If you want to test out your code, you can always use the keys here as an example:
Upload Code and Watch
That's it. Now upload your code and watch what happens. In the code, there are a few blink sequences that will indicate what it's doing. The first thing it does it set up the BMP180 sensor. When this is complete, it will blink quickly three times. It will then attempt to connect to WiFi. If this is successful, the LED will be ON and solid until the first attempt to post data.
When it posts data, it will read the BMP180 sensor, blink once to indicate this is complete, and then post to the data channel. If the post is successful, you should see three blinks in succession. Now go and check your data feed. You should see a new data point available.
If you're a developer or someone who likes to tinker with data, there are many ways to access the data from this feed. We provide direct links to JSON, CSV, MySQL, PostgreSQL and Atom formats.
My Setup
In our brooder, we set up a probe on the cool side and one on the warm side. We snaked the sensors in through the side and taped them in place using a small piece of electrical tape. The ESP8266 board can be powered by either a USB adapter or a Lithium Ion battery. We have ours plugged into the wall with the battery as a backup.
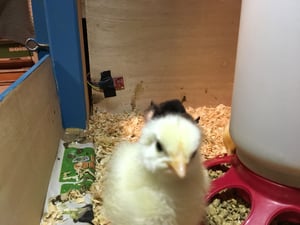
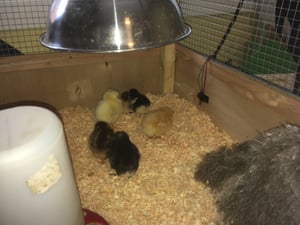
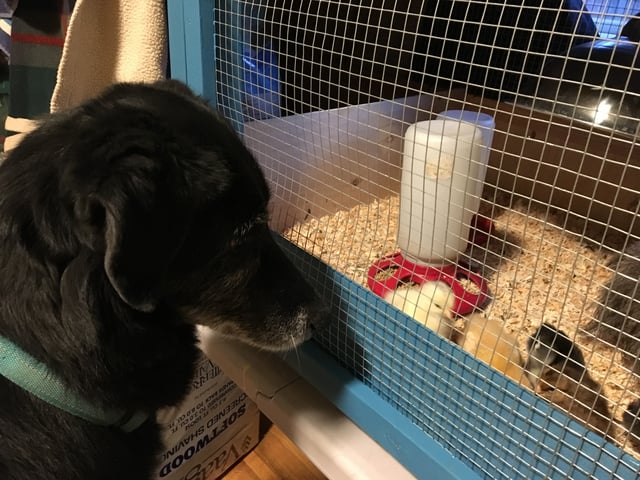
Here you can see the chicks are clearly congregating near the warmth of the heat lamp. The little yellow one was clearly curious what we were doing taking pictures inside her home!
Raw Data
Here's the raw data feed for our setup. We had to recently restart the cold side monitor, but you can see that there are two distinct probes in this data feed. The data.sparkfun.com channel will allow up to 100 posts per 15-minute interval. This works out to be roughly six posts per minute. I have my setup currently logging every 30 seconds, but you can modify that in the code to whatever interval you choose.
Now to graph the data — we used a few examples of graphing live data with Google Charts to create this quick dashboard. You could also use analog.io, but it doesn't allow you to easily parse out the separate sensors.

That's it.
So, whether you're working on raising baby chickens in your classroom or just want to wire up some temperature sensors around your home, here's a quick example to get you started. Our household loves the baby chicks — especially our dog!
Best of luck with your projects. Please share your thoughts and ideas in the comments below.


student projects, Internet of Things