Python offers a fun and easy entry into text-based programming, and is also used by professionals for quick prototyping to run websites, test algorithms and control robots. When used on the Raspberry Pi, Python can be a great way to teach physical computing, especially when it comes to collecting sensor data and creating graphs.
Data collection is key to many science experiments and discovery in the classroom. Equally important is for students to be able to analyze the data and be able to communicate it effectively. That's where the Python package matplotlib comes in.
Matplotlib allows users to programmatically create graphs using sets of data. This data can come from anywhere: manually entered, scraped from a website, or even sensors. Using a Raspberry Pi, we can collect data from a connected sensor and plot it!
.jpg?width=600&name=Matplotlib%20Tutorial-02%20(1).jpg)
Due to this ability to create plots on the fly (as opposed to copying static data into another program, such as Excel, to create a graph), we are able to create live plots that update in real-time. This means students can get instant feedback and look for trends in the moment of what's happening in the world around them.
If you are interested in learning how to use matplotlib to create graphs in Python, check out our new tutorial: Graph Sensor Data with Python and Matplotlib.

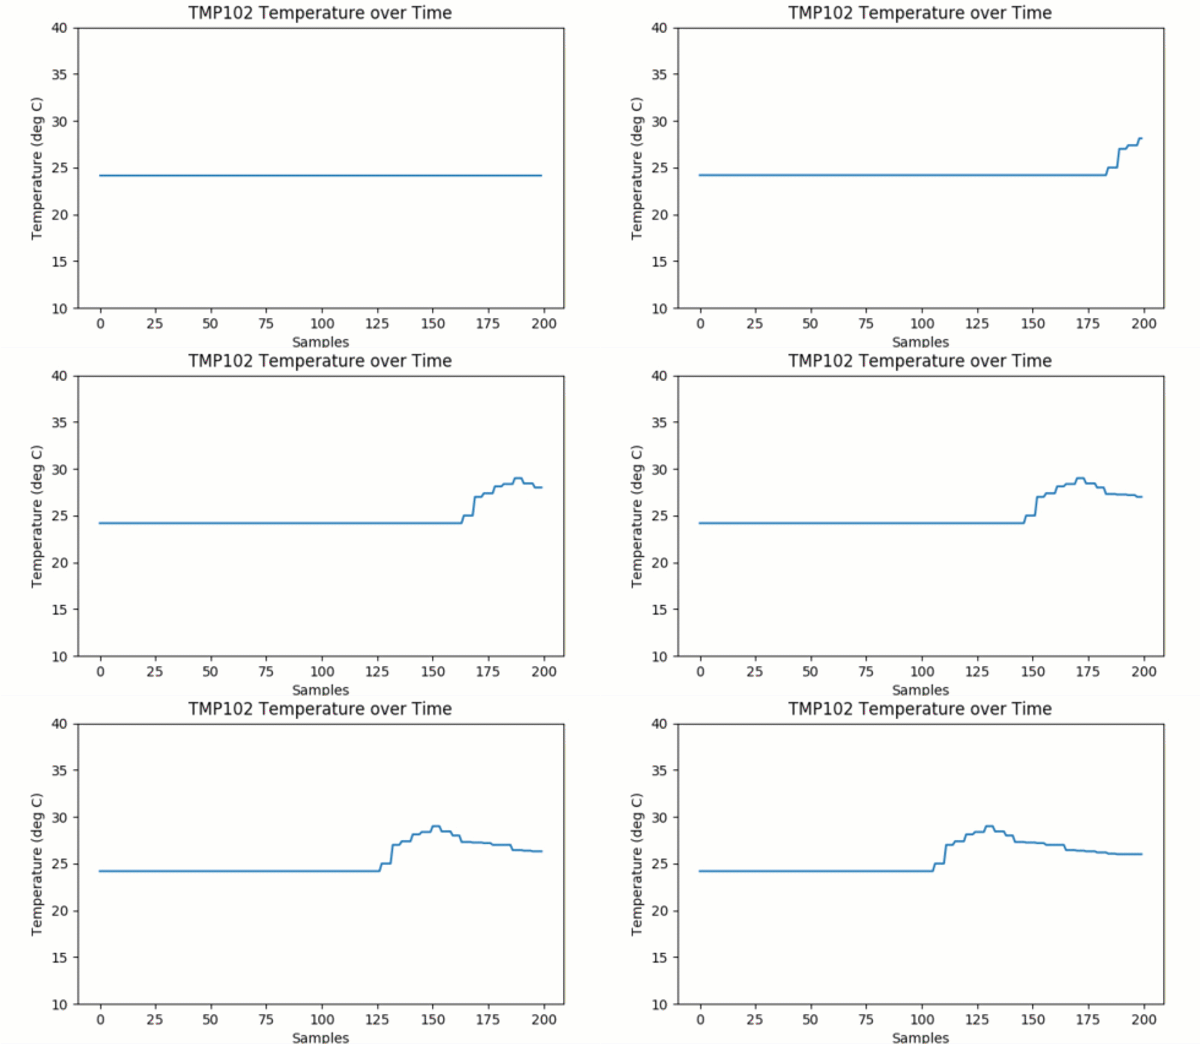
In it, we show you how to install and set up matplotlib on a Raspberry Pi and then walk you through the basics of creating graphs. From there, we describe three different methods of collecting sensor data and plotting it: collection before plotting, real-time plotting and tricks to speeding up the real-time plotting animation. Throughout the guide, we show data taken from a TMP102 temperature sensor, although any sensor that works with the Raspberry Pi could be used.
What kinds of experiments that involve sensor data collection have you done or would like to do with your students? Please let us know in the comments!


python, computer science