
I teach Arduino workshops at Tinkermill, our local maker space, to members from 8 to 80 years old. Some in my workshop are retired electrical engineers with 50 years of experience and some aren’t sure which end of a soldering iron to use.
I find one of the most confusing activities for my students new to Arduino, electronics and physical computing is figuring out the jumper wires between the Arduino board and the breadboard. This often gets in the way of a quick, successful project that builds confidence and helps accelerate the student up the learning curve.
To postpone the hassle of complicated wiring, I’ve developed a series of short projects that involve no wiring at all, instead using components inserted directly into the Arduino headers.
One of these projects is to measure the ambient temperature with a TMP36 temperature sensor, include in all generations of the Sparkfun Inventor Kit (SIK). It can also be purchased here, for $1.50. It is a simple device, powered with +5 V and gnd. The output voltage on the middle pin is a direct measure of the ambient temperature.
The data sheet offers the pin configuration. The pin connections, as viewed from the bottom of the device are shown in Figure 1. When viewed from the bottom, with the flat edge facing up, the left pin is the 5 V connection. The middle is the sensor output and the right pin is the gnd.
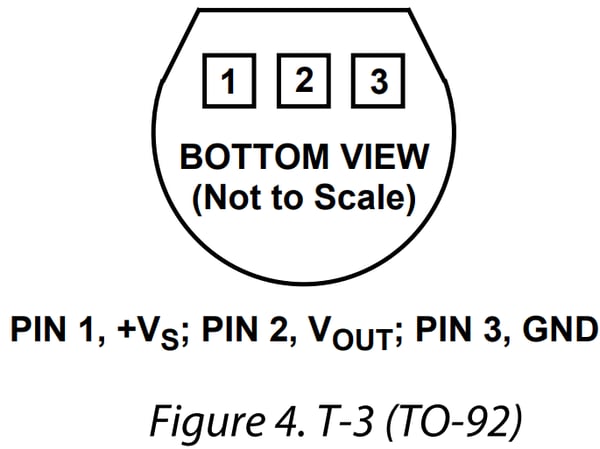
Figure 1. Pinout for the TMP36 temperature sensor.
Most project guides suggest plugging this sensor into a solderless breadboard and useing wires to connect between each pin and the +5 V, gnd and ADC channel.
Instead, we will use an important but not well known feature of each analog input pin. These pins are really, general purpose I/O (GPIO) pins. They can be used as digital pins and analog pins. The plan is to insert the TMP36 directly into three adjacent analog pins and set the pins to provide the 5 V and gnd with the middle pin as the analog input.
When the TMP36 is inserted into the Arduino headers A0, A1 and A2, with the flat edge facing inward, the connections are:
- A2: pin 1 (+5V)
- A1: pin 2 (Vout)
- A0: pin 3 (gnd)
It never hurts to double check these connections. This set up is shown in Figure 2.
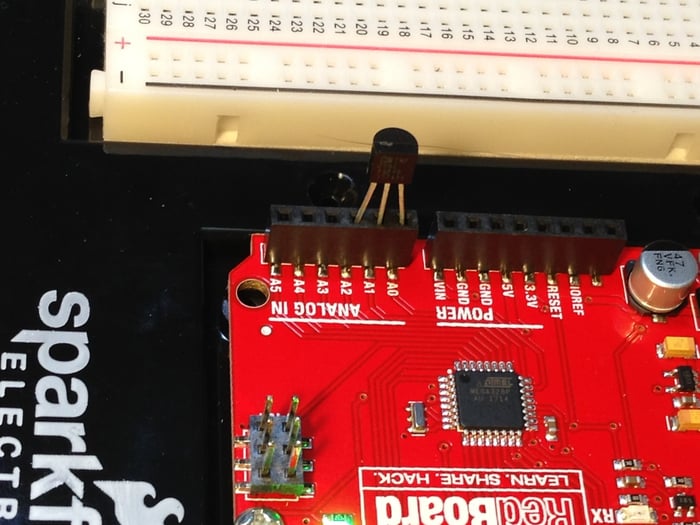
Figure 2. The TMP36 inserted into the A2, A1 and A0 analog pins.
The sketch we write will set up pins A2 and A0 with the correct voltages, then read the analog voltage on pin A1. In one command line, we can print the readings from the analog pin A1 to the serial monitor. I added a short delay in the loop to slow down the rate at which data is printed to the screen. The code is very simple:
// direct reading a TMP36
// Eric Bogatin, www.HackingPhysics.com
void setup() {
pinMode(A0, OUTPUT);
digitalWrite(A0, LOW);
pinMode(A2, OUTPUT);
digitalWrite(A2, HIGH);
Serial.begin(9600);
}
void loop() {
Serial.println(analogRead(A1));
delay(100);
}
When this is run, the raw ADC measurements can be displayed on the serial monitor. Alternatively, the raw ADC values can be plotted on the serial plotter. An example of the raw ADC values after I touched the sensor, are shown in Figure 3.
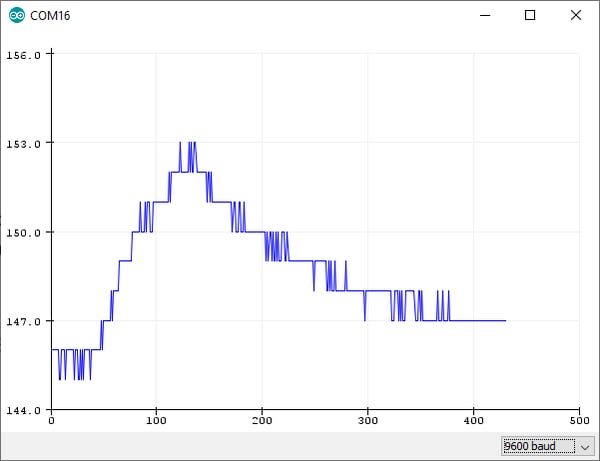
Figure 3. Plotting the temperature of the sensor after I touched it.
This is only the starting place. In literally 10 minutes, a student can go from nothing to a working data acquisition system measuring the ambient room temperature.
The next steps can be:
- Instead of plotting the ADC values, convert them into degrees C or degrees F.
- Instead of using a delay to slow down the display, average the measurements over some time period or over some number of samples. This will both slow the display and increase the resolution.
- With confidence of the connections, solder wires to the ends of the TMP36 and place the sensor somewhere more interesting, like in a coffee cup or thermos bottle.
Implementing some of these features using variables, adding for loops and a little arithmetic, we can turn the raw measurements into a more useful display of temperature, in degrees F, over time, as shown in Figure 4. The steps in the plot are due to the limited resolution of the 10-bit ADC of the microcontroller chip.
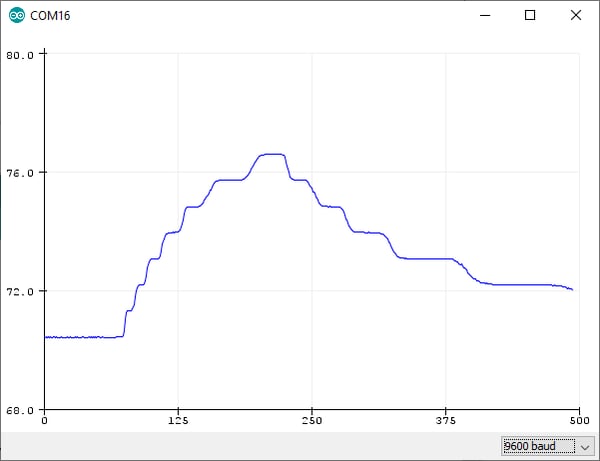
Figure 4. The measured temperature in degrees F.
You can download the very simple sketch that does all the conversions and averaging here.
Eric received his BS in Physics from MIT and PhD in Physics from the University of Arizona in Tucson. He currently teaches graduate electrical engineering classes at CU, Boulder, Arduino workshops at Tinkermill and is a Signal Integrity Evangelist with Teledyne LeCroy. For more information about these and similar Arduino projects, check out his Amazon Author’s page or his web site, www.HackingPhysics.com.
Arduino, teaching tools, getting started, helpful information, basic circuits